A Quick Congratulations
Hello, and welcome back to the “SMB Fundamentals” series.
Let’s take a minute to congratulate you! We have covered some fundamental, and powerful concepts in finance. Now you know how to think about ROI, Investing for Growth, and Balance Sheets. Safe to say you are getting clued up without paying $60,000 for an MBA…Kudos to you.
This post is going to be focusing on Free Cash Flow (“FCF”). Don’t freak out if this sounds like gibberish. Every other term I mentioned sounds very weird and you have handled it well! So, relax and enjoy!
Our Basic Desire - SMB Edition
I want to ask you a question. What is the purpose of a business?
No, this is not a trick question. It is a simple question but take it very seriously. Just have a think. At the end of the day, what do we ultimately want from a business?
You may say to make a profit, to provide an income stream, or to increase profit per dollar invested…
Yes, these are all correct but think more simply. What are these all connected by? What is profit?
I’ll give you a hint: the answer begins with a C and rhymes with mash… I hope you got it… CASH!
The purpose of a business is to generate cash and lots of it. Cash is king!
Profit is the difference between the price at which one can sell a good or service minus the costs of supplying it. Cash is the result of turning a profit.
If appropriate, cash can be reinvested back into the business. Alternatively, an owner can dividend cash out so they can buy a home, a car, clothes or quench that chocolate cake addiction that I have found myself in… Moving on!
Free Cash Flow is the metric used to see how much cash a business is generating.
We prefer businesses that drown in cash. An example of a different business is construction equipment. You work hard all year and there is your profit sitting in the yard. We avoid businesses like that. We prefer those that can write us a check at the end of the year.” – Charlie Munger, 2008 Berkshire Hathaway Annual Meeting
Net Income
Net income is the profit a business generates. Earlier, we said, “Profit is the difference between the price one can sell a good or service for, less the costs to supply it. Cash is the result of turning a profit.” This is true; however, the increase in cash in your bank account from one year to the next rarely matches Net Income.
The Income Statement includes non-cash expenses. In addition, it does not show changes in working capital which eat or bring in cash – the details are found on the Cash Flow Statement. Explaining what this means will be the meat of today’s post.
At a high level, accounting rules smooth the fluctuations in a business to give us a better idea of the underlying profit generated. Instead of trying to piece together a bunch of moving parts, our trusty accountants have put together a set of rules that help us better understand a business.
I promise they aren’t trying to make your life difficult! Their tools help to analyse 1) The underlying economics of a business – Income Statement, 2) What we own and how we funded it – Balance Sheet, and 3) How it turns into cash – Cash Flow Statement. Net income is therefore an approximation of the economic profit using accounting rules.
The cash flow statement is useful because it helps back out accounting rules to show how much cash is generated during a period. To reverse engineer our way back to the cash generated we start with Net Income, found at the bottom of the income statement.
Depreciation and Amortization
Depreciation is a non-cash expense that represents the wear and tear of Fixed Assets.
Fixed assets (PP&E – buildings, machines, plant and equipment) are long-term assets that enable day-to–day operations to take place. Such assets are used in, or house, the creation of goods and services. Fixed assets are expected to 1) Last a long time and 2) Provide economic benefit over their whole lifetime.
In contrast, any benefits from money spent on sales and marketing, or admin is likely to be experienced in term – expenses are recognized straight away.
Therefore, accounting rules say it is more appropriate to “capitalize” the expenditure on the balance sheet to show that asset’s value in future periods – hence capital expenditure.
The table shows a company purchasing new PP&E assets. The PP&E balance increases by the amount of CapEx. The total amount invested into all existing PP&E assets is called “Gross PP&E”.

We can agree that a brand-new factory/machine/plant is worth more than the exact same factory/machine/plant but 10 years older. Why?
As PP&E is used/ages its value is depleted, and the asset is more likely to break down. Accountants use depreciation expense to represent the economic effect of wear and tear.
Say a store building costs $100 (I know… cheap real estate!), and we are confident the building will be equally functional for 10 years. Instead of recognizing a $100 expense in Year 1, the purchase is capitalized as PP&E on the balance sheet. Then we spread the cost over the asset’s useful life. Since the purchase was $100 and the building is expected to last 10 years, we depreciate the asset at $10 annually. In subsequent years, the “gross” value of PP&E is adjusted for total accumulated depreciation to give Net PP&E.
At the end of Year 1 the Net PP&E value would be $90 ($100-$10 = $90), $80 at the end of Year 2, and so on until the asset is fully depreciated.
The important point you must take away is that depreciation expenses are non-cash.
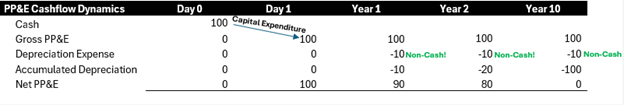
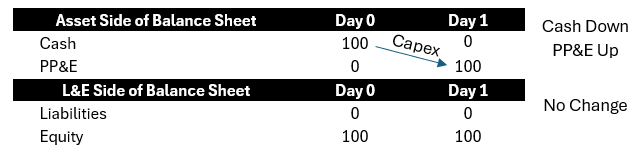
Notice the difference in timing of cash flows vs expenses recognized.
PP&E is purchased upfront – a cash outflow.
From Year 1 to Year 10, despite recording all those depreciation expenses we didn’t part with any cash apart from the initial purchase.
On the Income Statement, however, accounting appears to “spread” the cash outflow from the initial purchase to match the asset’s depreciation in later years via depreciation expenses. Another way to think about it is depreciation expenses are roughly equal to the costs to purchase X% of the asset every year – in this case 10% of a the store.
Importantly, we now understand that depreciation expenses are non-cash.
If we want to see how much cash is being generated we need to add back all non-cash expenses to Net Income. In our Free Cash Flow calculation, we add back the depreciation expenses to get closer to the cash generated from operations.
Changes in Net Working Capital
I am going to try to illustrate how working capital affects cash flow by showing the accounting mechanics. In the following examples, I will use a mix of Charlie’s annual and monthly Financial Statements from his first months in business when he was a “start-up”.
The goal is not to show how much cash is needed to start a business but to illustrate how working capital affects cash flow. Start-up examples are particularly useful because (A) the changes in working capital are more pronounced, making them easier to see, and (B) it’s simpler to understand these concepts from a start-up perspective. Once we are comfortable with the start-up examples, we will see how working capital affects a company at an annual level.
Let’s go back to when Charlie first started up his business – Cinnamon Charlies. Our favourite entrepreneur has done his calculations on the costs for a new store with a renovation and all the equipment he needs. Using his calculations he needs $2,700 cash to start. Charlie uses his start-up capital and goes into business.
Point #1 – Inventory
Charlie has used up all his start-up capital buying the store, renovation and equipment. After getting his store ready he realizes he doesn’t have any money to buy raw materials to make biscuits.
To build inventory, Charlie needs to inject more cash to make sure he has product to sell. Since Charlie will always need a constant amount of inventory this represents a permanent investment.
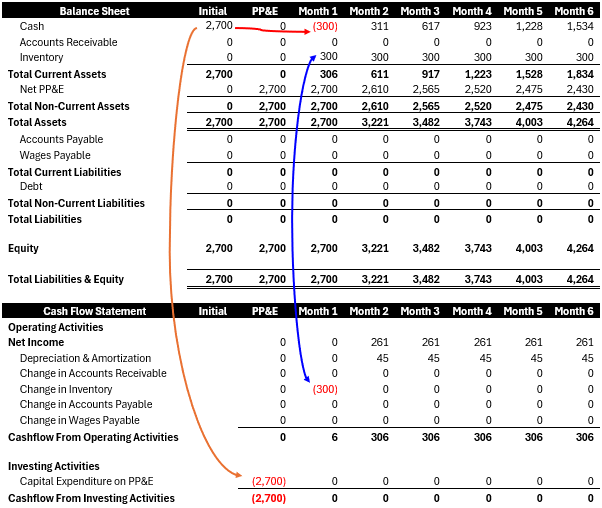
Look below in Charlie’s first month of business before he starts selling products. After purchasing PP&E, Charlie has no money left to purchase Inventory, and therefore sell product to his customers.
He needs an extra $300 of cash to pay for raw materials to make inventory.
The same thing happens if revenue grows. A business needs more inventory, on an absolute basis, to support higher revenue. If Charlie keeps inventory at 3% of revenue, then if revenue grows the amount of inventory he holds must grow too. Look at how as revenue grows; the inventory balance goes up too. Cash is being absorbed into inventory.
Key Point: Inventory Eats Up Cash
N.B. The opposite is true if Inventory shrinks – balances of Current Assets (Inventory, or AR) are liquidated and provide cash.
Point #2 – Accounts Receivable
A similar situation occurs with AR. In the balance sheets above there is no AR balance suggesting Charlie is only accepting cash payment…
What happens if Charlie only sells to large supermarkets that delay payments?
Instead of receiving cash now, Charlie allows customers to pay later. When Charlie accepts a delayed payment, he gives his customers a short-term loan to buy his products. It’s as if Charlie got money from a customer, and immediately gave it straight back saying they could pay at a later date.
As soon as he delivers his biscuits, Charlie will record the revenue in his accounts to show he has made a sale, but he also needs to create an equal AR balance for the money he is owed.
We can see there where the mismatch between Revenue (and therefore Net Income), and Cash flow arises.
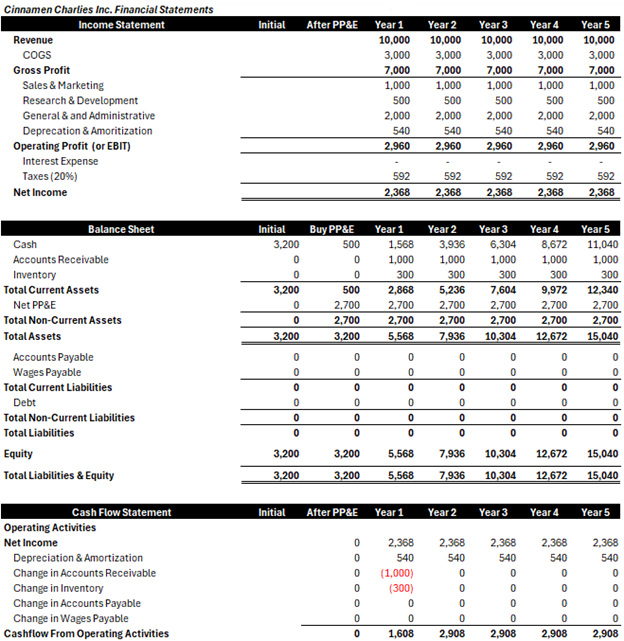
Using the Monthly Financial Statements (this time with enough start up capital for Inventory in first month), we see Charlie’s AR balance will increase until it reaches its steady state at $1,000. In reality, there is no perfect steady state, but we are using $1,000 for the sake of example. Look at how the AR balance builds up.
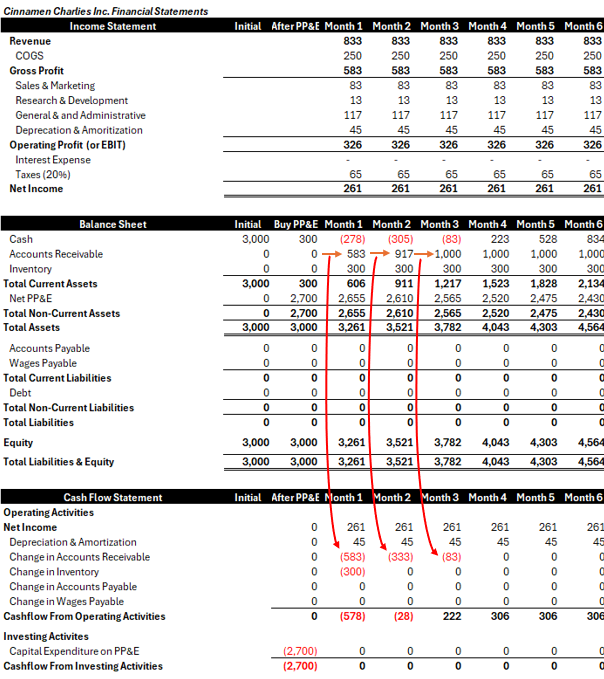
Remember, AR is effectively a short-term loan to customers to incentivise them to purchase your products. An increase in AR is therefore a cash outflow – an outlay of cash to customers. Looking at the financial statements we can see there will be a shortfall of cash! As Charlie starts his business, he needs to account for Accounts Receivable
Like Inventory, we can see here that AR absorbs cash as the balance grows from $0 to $1,000. Hence Charlie needs even more cash to cover the delayed payments when starting his business. Looking at the Cashflow from operations below we can see that the AR balance sucks up another $583 in Month 1, $333 in Month 2, and $83 in Month 3.
In this example, Charlie starts to generate cash only in the 3rd month! In addition to $2,700 for PP&E Charlie would need an additional $905 to cover the absorption of Inventory ($300) and AR ($605) – and that is without having any safety cushion of cash for an emergency!
Key Point: Accounts Receivable Eat Up Cash
Like inventory, however, a declining AR balance will BRING IN cash – Customers pay amounts due faster than new AR replacing it – a cash inflow.
After Year 1, Charlie’s AR and Inventory continue to increase with revenue growth. As a result, AR and Inventory continue to eat cash and tie up capital on the balance sheet to support the business’s growth. Using the analysis, Charlie has also decided to use $4,000 of start-up capital.
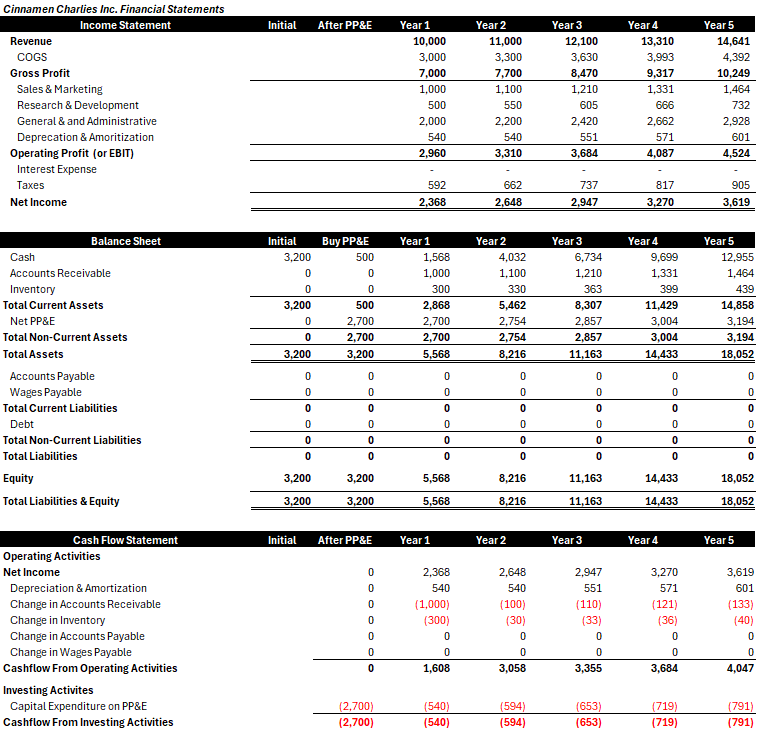
If we take growth to 0% after the first year Inventory and AR remain the same and do eat more cash. The working capital adequatley supports revenue.
The easiest way to remember is that cash is eaten by assets. The more you grow revenue, the more assets you need to support growth, the more cash will be eaten.
Point #3 – Current Liabilities (Accounts Payable and Wages Payable)
On the other side of working capital are Current Liabilities which bring in cash.
Over a period of time a company incurs expenses for the raw materials, labour, and services used in the production process. But companies often don’t pay for raw materials the moment they arrive nor wages at day’s end. If a company paid wages as soon as they were due cash outflows would be immediate and match expenses on the Income Statement.
Luckily, companies are allowed to pay to vendors, suppliers and staff at a delay. The owed money needs to be paid shortly so we create a Current Liability on the balance sheet.
Vendors, suppliers and employees effectively provide a short-term loan to the company! As stated, an increase in current liabilities is a cash inflow when. It is the other side of Accounts Receivable – now we are the customer.
Let’s look at example with only Current Liabilities in the first 6 months of operations.
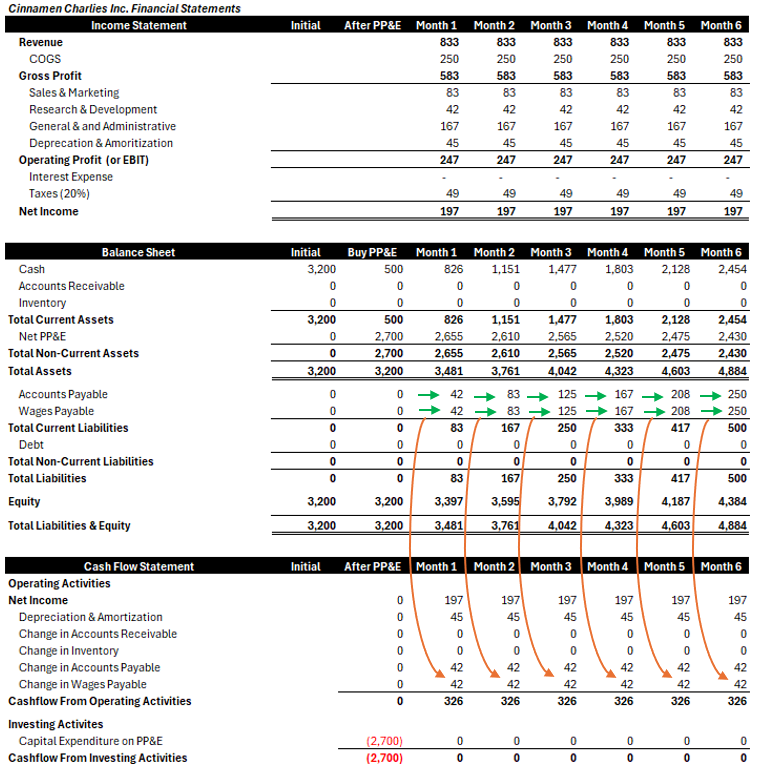
As the balance of AP and WP increases, we can see that Cashflow from Operations exceeds Net Income + Depreciations.
While the expenses are immediately recognized on the Income Statement, Charlie delays the payment of his costs each month. The creation of Current Liabilities, since more costs are owed at the end of the month, retains cash – a cash inflow when compared to Net Income.
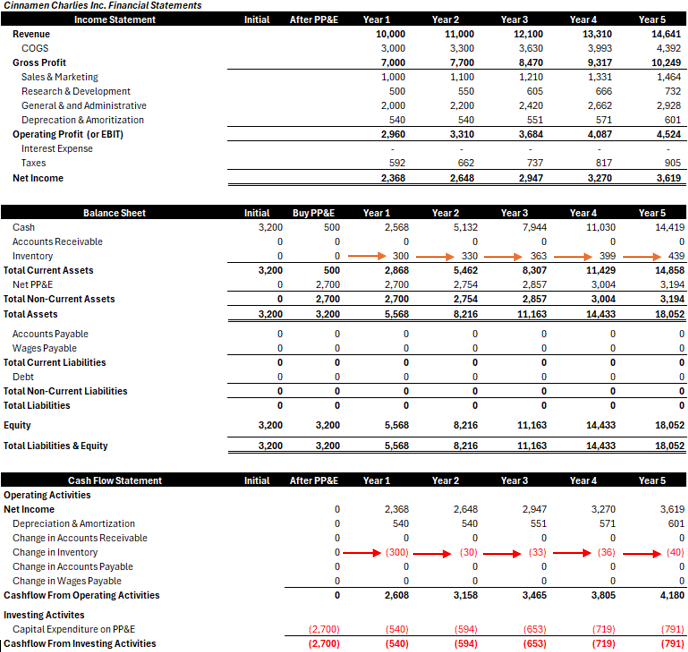
Now look at the annual financial statements for a growing Cinnamon Charlie’s business , with Inventory, AR and AP.
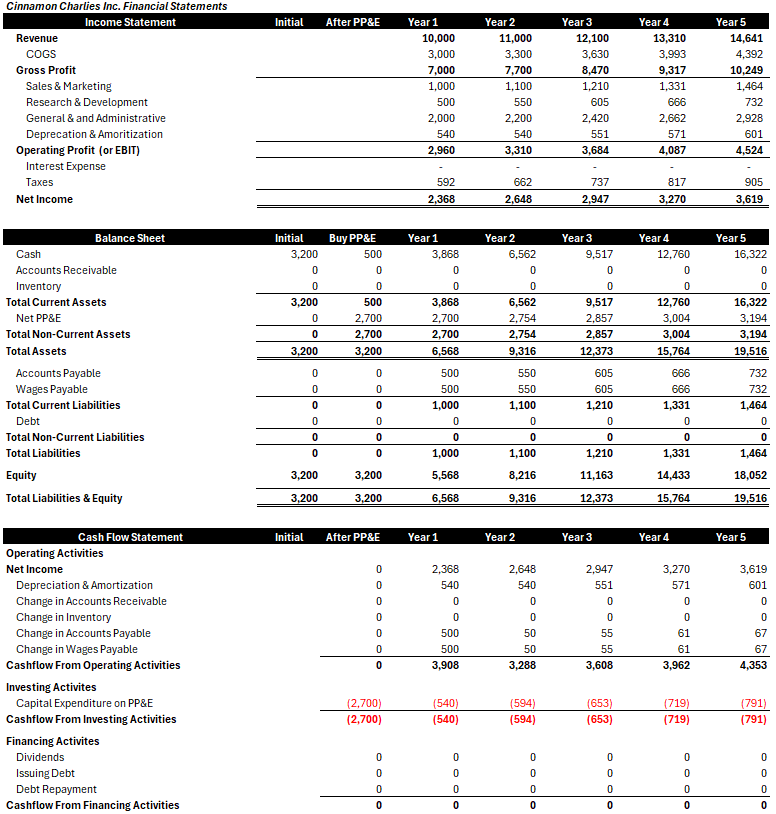
At the end of Year 1, we see Charlie has delayed payments to vendors (Accounts Payable) and Employees (Wages Payable) of $500 each. As a result, he has kept $1,000 in his bank account that would have had to be paid if wages were paid daily, or expenses the day a product or service is used. The delayed payment is a source of cash.
As the business grows, Accounts Payable and Wages Payable continue to provide cash. The increase in the amount of cash owed is cash kept in the business owner!
Just like with Current Assets, the opposite is true when revenues decline. More Current Liabilities are paid off than Current Liabilities replaced so cash is sucked out the business.
Key Point: Liabilities Provide Cash
Putting it all together we can get the full picture of how working capital affects cash generated by a business.
In our FCF calculation we can see how the changes in Working Capital are directly relevant. Changes in Current Assets & Liabilites impact the cash a business generates at the end of a period. By backing out the movement in working capital we get closer to the cash coming into the company’s bank account.
Remember, Assets eat cash while in Liabilities bring in cash.
Cashflow From Operations
This is very close to the whole picture of what cash is being throw off by a business. But we are missing one crucial feature that we spoke about earlier!
Capital Expenditure
I am sure you are all sick of the repetition on this piece. The reason I am doing it, however, is because I want to solidify your understanding. Now for the last piece in the puzzle 
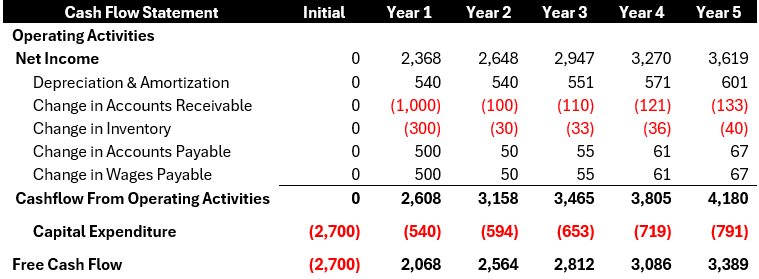
The last part of the FCF formula is subtracting Capital Expenditure, or CapEx. As stated before, CapEx is the purchase of PP&E.
The reason we subtract CapEx from Cashflow from Operations is because the expenditure is not expensed immediately on the Income Statement. PP&E assets 1) last a long time and 2) we will provide future economic benefit from over their lifetime. In contrast, any benefits from money spent on sales and marketing, or admin is experienced in the near term so expenses are recognized straight away.
Instead, accounting rules say it is more appropriate to “capitalize” the CapEx on the balance sheet to show that asset’s value in future periods. CapEx is a cash outflow that represents a (re)investment you’re your business.
Since CapEx is not recognized on the Income Statement, the expenditure also does not affect Net Income or Cashflow from Operations. To arrive at the cash generated by the business we must subtract the CapEx from Cashflow from Operations.
To be sure, businesses may in a given year be able to defer capital spending. However, they must make the investment over a five- or ten-year period or the business decays. CapEx to a business is what feeding is to an animal. If the business is growing you must feed it more cash so it can sustain itself. If the business is not growing, it needs less food to sustain itself. Too much food will cause any animal to put on weight and be out of shape (think low ROIs). If you defer CapEx (do not feed the business) the business will shrink as it will not receive the investment it needs.
Ultimately, an owner needs to spend on CapEx that allows a business to fully maintain its long-term competitive position, and unit volume at a satisfactory ROI. If the business requires additional working capital to maintain its competitive position and unit volume, the increment also should be included.
Maintenance vs Growth CapEx
We have gone over what CapEx is. Now we can look at the reasons for spending on CapEx.
There are two reasons to invest in PP&E:
Maintenance – To maintain the existing production capacity.
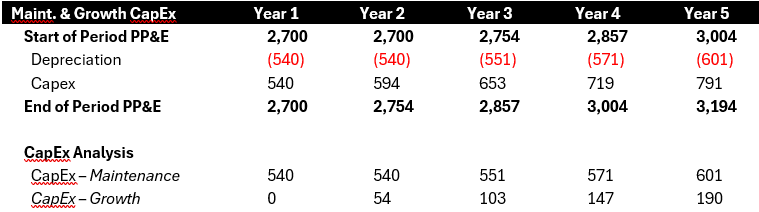
A company sustains the current level production capacity by keeping current levels of Net PP&E. We maintain production capacity by offsetting the amount of depreciation with a corresponding amount of CapEx.
We can analyse FCF while only incorporating maintenance CapEx. In theory, this tells us how much cash a business is generating if it were to stop growing, or if you stopped investing in growth.
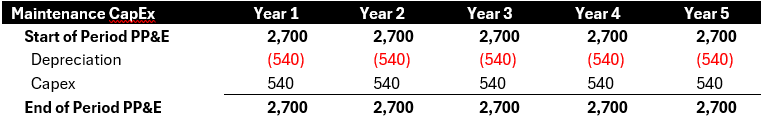
In reality, maintenance Capex is higher than depreciation. Owners need to spend more than depreciation on their businesses over the longer term just to hold their ground in terms of both unit volume and competitive position.
Depreciation expenses are derived from what we pay for an asset. So, if we purchased that asset 10 years ago we are depreciating the asset off the price 10 years ago. When we come to replace the asset we can only buy at current prices and technology level to remain competitive. Hence maintenance CapEx is technically a bit higher than depreciation.
Growth
To grow production capacity, a company must more spend more on CapEx than the amount of depreciation to increase PP&E. All else equal, more PP&E can produce more product, or services and therefore more revenue. The amount of CapEx that exceeds depreciation is called Growth CapEx.
If you are reinvesting in your business to grow, however, to determine the cash a business will generate after accounting for growth you need to subtract the all CapEx spent.
Free Cash Flow Conversion
Now we know how to calculate Free Cash Flow. How does it compare to Net Income? Lets look at a no growth and growing company to see how they differ.
No Growth Company
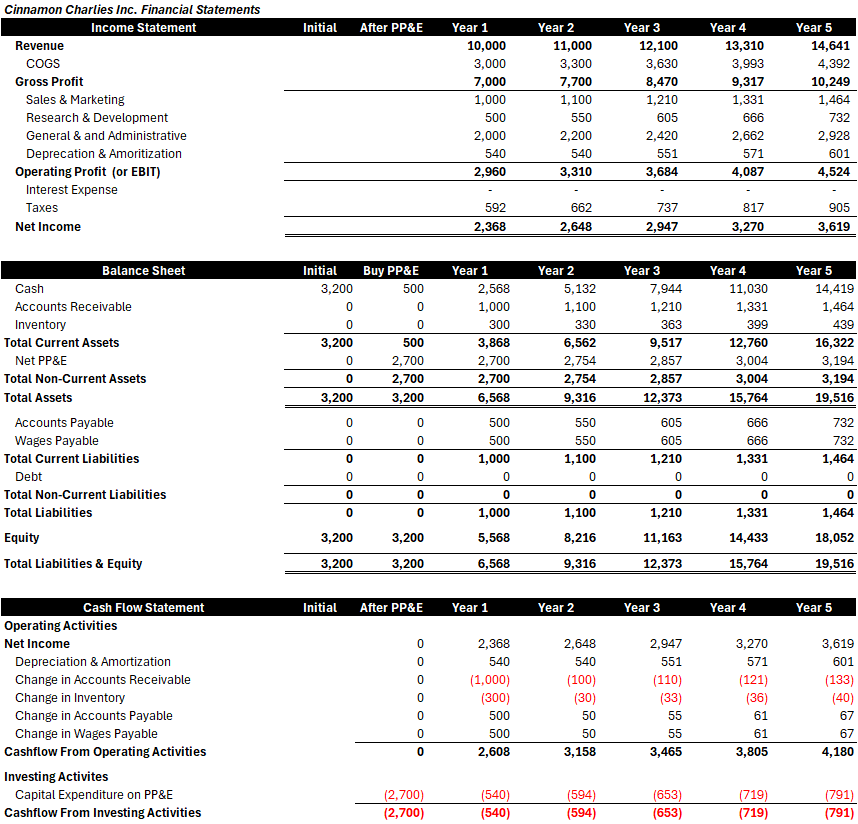
Look at the financial statements, focusing on Net Income & Cashflow Statement.
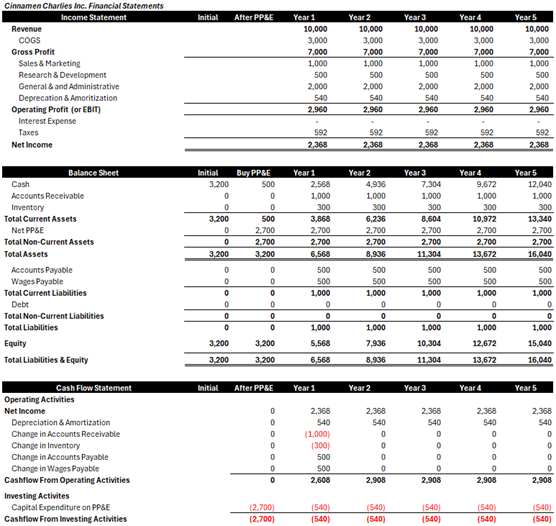
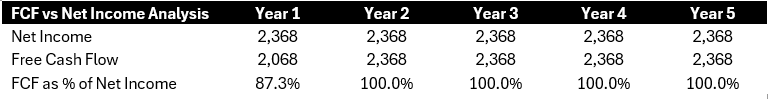
Now we can look at how Net Income converts into Free Cash Flow. In Year 1 Charlie starts his business, and FCF is less than Net Income. Depreciation and Capex offset each other. However, the change in Net Working Capital (current assets minus current liabilities) absorbs the cash. In the following years Net working capital doesn’t change, while Capex and Depreciation continue to offset each other. In reality it will never be a smooth exactly but it should be in the same neighbourhood.
After Year 1, Net Income converts 100% into Free Cash Flow.
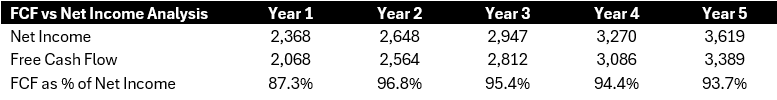
Growing Company
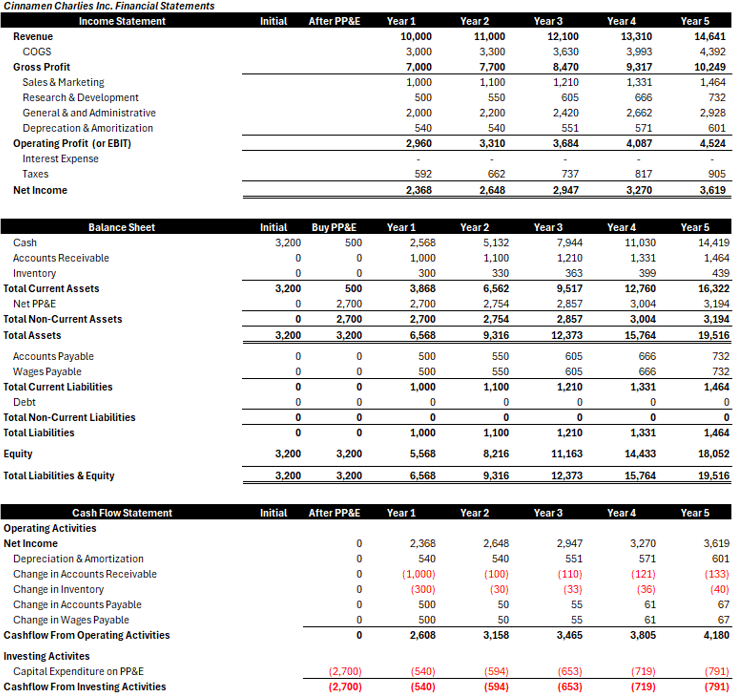
Now look at the difference for a growing company. In Year 2 to Year 5 we see that Net Income converts Free Cash Flow at less than 100% because 1) Changes in Net Working Capital eat cash and 2) Growth CapEx eats cash.
Concluding Thoughts
VOILA!
We have arrived at Free Cash Flow! This is a major concept in finance in business. It is imperative you know how much cash your business is generating. Being able to calculate Free Cash Flow is a major step to increasing your awareness of your business’s finances.
Free Cash Flow is NOT intuitive, so if you can understand this then well done to you!
N.B.
Please note that this is example has an exceptionally good Free Cash Flow Conversion. This is in the upper echelons of what one can hope for in a growing business. Why?
Because the business does not eat a lot of capital as it grows. It throws off cash to its owner. Yes, these balances absorb a little bit of cash, but on the whole, the vast majority goes straight to the bank! Most companies have higher working capital requirements or need to invest more in PP&E to grow. As we know this eats capital!
We have just touched on the subject of the next post – Capital Intensity!