Asset-Heavy (Hungry) Businesses
Asset-heavy businesses are companies that need a lot of assets to operate and are inefficient at turning those assets into sales and profit. Asset-heavy business models include rail companies, mines, refineries, construction, and manufacturers – businesses with substantial amounts of machines, plant & equipment, inventory, and/or accounts receivable. Asset-heavy businesses are called capital-intensive because they consume vast amounts of cash (capital).
Using an analogy, asset-intensive businesses are like elephants. An elephant’s huge physique and inefficient stomach means it must eat over 150 kg of food per day to grow or maintain its body. Similarly, asset-heavy businesses need plenty of cash to build their asset base. Secondly, a high proportion of profit needs to be reinvested just to replace the depreciating PP&E at the current technology levels and prices to stay competitive (inflation, therefore, is very impactful to an asset-hungry business). Secondly, cash is needed to fund increases in net working capital.
A natural follow-up question: are all businesses equally hungry?
The answer:
“All businesses are hungry, but some businesses are more hungry than others.”
Matt Pein, 2024
I have adapted George Orwell’s line because it fits rather well. Instead of describing communist pigs, however, I am talking about the cash needs of a business. I will use animal metaphors to illustrate the ideas in this post.
Asset-Heavy Businesses Are Hungriest When Growing
When we grow we tend to eat a lot. As kids, particularly teenagers, we need to fuel growth and development in our bodies. Similarly, as a company grows it needs more assets to support the added revenue. Instead of consuming calcium, protein and green vegetables (you are welcome mum), however, businesses have a rather fussy palate. Only cash will do! Cash gets absorbed into working capital and fixed assets (PP&E) to support extra revenue and unit volumes.
Mature businesses still require ongoing investment in working capital and PP&E. However, because they grow more slowly, their primary need is to maintain, rather than expand their assets. Working capital should stay consistent, while fixed asset depreciation must be offset by Capital Expenditure (CapEx) to sustain unit volume and competitive position. Maintenance CapEx becomes the main absorption of cash in a mature business.
A growing business isn’t necessarily asset-heavy, but it will eat more cash than a non-growing one. Asset-heavy businesses require even more cash as they grow, versus an asset-light company. The key is the relative cash consumed to generate each dollar of sales or income.
Formulas Measuring Capital Intensity
From previous discussions, we know that Net Tangible Assets (“NTA”) is Current Assets (excluding cash) less Current Liabilities plus Net PP&E. NTA becomes a useful metric for us to see a business’s productivity.
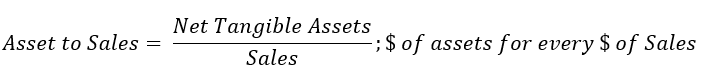
A metric to assess how much NTA a business uses to produce a dollar of sales, or grow sales by a dollar.

The amount of Net Tangible Assets needed to produce a dollar of Net Income or Operating Profit after Tax.

The amount of Net Tangible Assets needed to produce a dollar of FCF. Be careful using this formula with growing companies because part of the cash flow generated will go back into the business as Growth CapEx. If a business is not growing at a satisfactory ROI, and the owner wisely decides to not spend money on increasing production capacity, all FCF after Maintenance CapEx will flow to the owner.
Below is an interesting formula. I call it the Cash Absorption Rate. It says: “How much of the cash the business generates is absorbed back into the business.”

The numerator is the parts we subtract in the FCF formula (Change in NWC and CapEx) – where our cash is absorbed. While the denominator is where the cash is generated comes from. This is an interesting metric to assess how capital-intensive a business is.
Capital Intensity Accounting Mechanics
Ok, your done with my metaphor, so how does a company “absorb” cash?
Look at the FCF formula.
Firstly, we add Net Income and D&A to arrive at the cash generated. Second, we subtract CapEx and any increase in Net Working Capital (“NWC”). The change in NWC and CapEx is where the cash gets “eaten”. We can see the effects on the financial statements below – I’ve got some more pictures to show you the mechanics.
Quick Point: NWC
Before we begin the analysis, it is worth pointing out that NWC is dynamic and can erratically change. Monthly or yearly results can be skewed by temporary external events impacting the business. For example, a large economic slowdown may cause inventory to build up for six to twelve months causing cash to be tied up in inventory. A similar issue arises if a large customer delays payment. Delayed payments cause an increase in Accounts Receivable and the corresponding cash isn’t received on time – cash absorbed into AR. Both events would lead to a higher cash absorption rate. While meaningful, when analysing capital intensity we are trying to see what happens to a business in its steady state.
In this instance, it is ok to “look through” the abnormal event. Abnormalities are still good to consider, be aware of and plan accordingly, but they are not the central point to a capital intensity analysis.
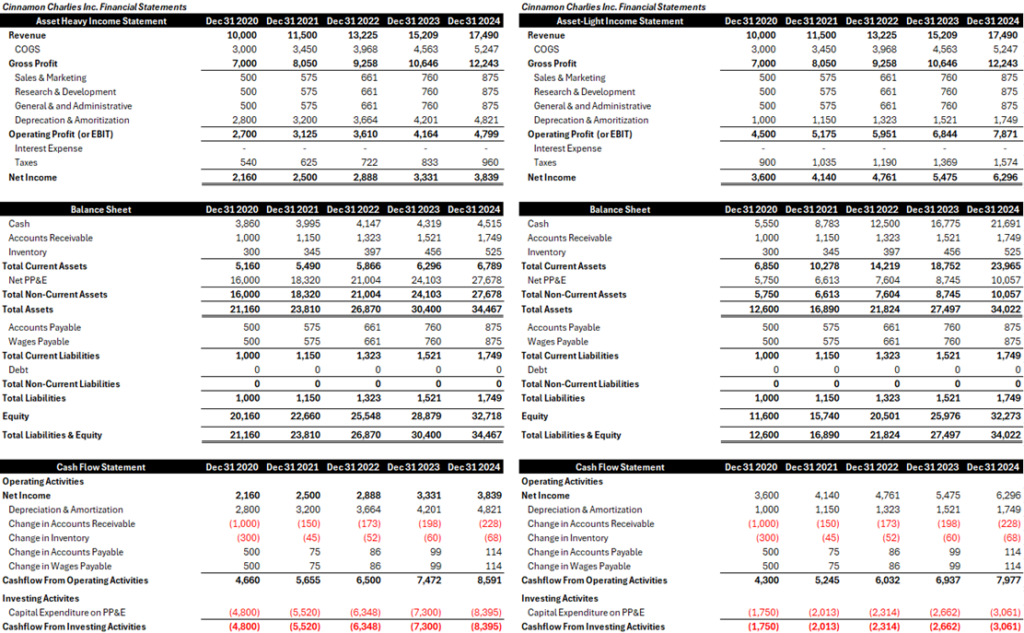
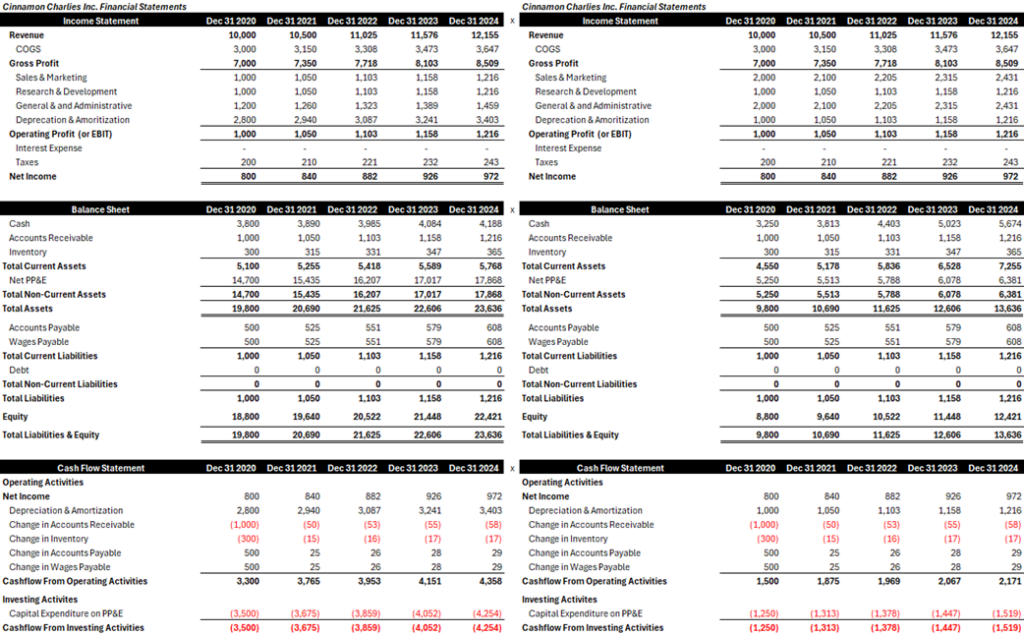
Asset-Heavy (Left) vs Asset-Light (Right): Low Growth

Revenue is the same for both companies. The only difference is their PP&E. The asset-heavy company (left) has much more PP&E. The large depreciation expenses stemming, from PP&E assets, brings down operating income.
Interestingly, Cashflow from Operations is higher for the asset-heavy company due to the large, non-cash deprecation expenses. We know FCF is the ultimate metric. A business must replenish its fixed assets so subtracting CapEx offers better insight into cash generated.
The first thing to note is the FCF for the company on the left (asset-heavy) is significantly higher. The CapEx requirements are much higher due to the PP&E. The sales per dollar of NTA shows asset-heavy business requiring ~$1.55 vs $0.64 in NTA to generate one dollar of sales. The trend is amplified with net income. The asset-heavy company needs $7.18 of assets to generate a dollar of Net Income vs $1.78 for the asset-light business.
The cash absorption rate shows a similar trend. Only 24% of the cash generated is absorbed back into the asset-light business while 61% of generated cash in the asset-heavy business is reabsorbed.
Secondly, the need to increase the asset base with such tepid growth is not substantial. For both businesses, Net Income converts to FCF at near 100%. The asset-heavy business, however, requires slightly more CapEx to replace PP&E assets pushing FCF conversion lower.
Low-growth businesses should convert a high percentage of net income to FCF. While still high, Asset-heavy businesses will absorb relatively more cash to maintain their competitive position and volume capacity from CapEx.
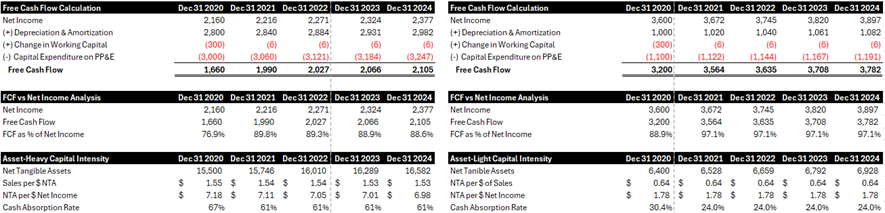
Asset-Heavy (Right) vs Asset-Light (Left): Growing 15% a year
The difference here, in the second set of financials, is that both companies are growing at 15%/yr. To support the growth, the asset-heavy business must spend much more on CapEx and, to a smaller extent, working capital. Only 5% of the asset-heavy business’s net income converts into FCF meaning almost all cash generated is reabsorbed.
The asset-light business is growing at the same rate, however, it is throwing off much more cash in absolute dollar amounts and as a percentage of net income. This is a direct result of the capital intensity of the two different businesses – in this case, the CapEx to grow.
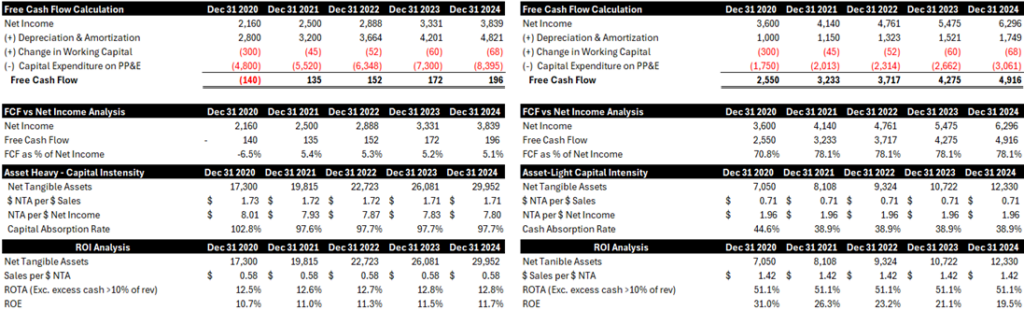
Asset-Heavy vs Asset-Light: Equal Margins
Now look at what happens when two companies are both growing at 5% a year and have 10% operating margins but differing levels of capital intensity. What happens to their return on investment and FCF?
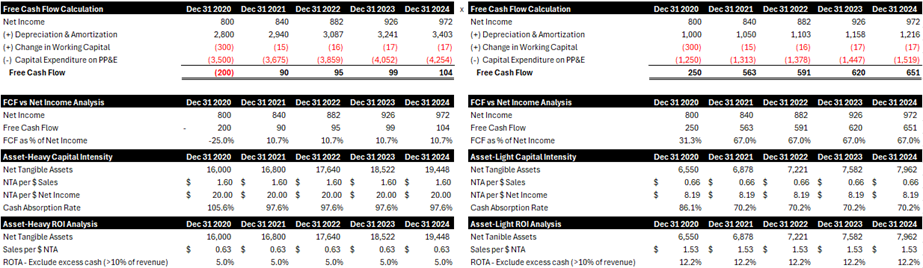
Firstly, like we saw before, the asset-heavy business has much lower FCF converting only ~11% of net income to FCF vs 67% for the more asset-light business despite both generating the same net income. The asset-heavy business absorbs cash via CapEx, and the increase in NWC in contrast to the asset-light business where two thirds of the net income go to cash. While both businesses generate the same amount of income, clearly the asset-light business is more favorable to own. The NTA per dollar of net income needed shows the differing need for assets: $20 vs $8.19.
Economics Matters
Look at the ROI Analysis. The asset-light business has considerably lower net tangible assets and thus higher return on tangible assets. The company is much more productive with its asset base and doesn’t need to replace depreciated PP&E resulting in higher FCF. If we inverse the $20 and $8.19 NTA per dollar of net income ratios we get the 5% ROTA and 12.2% ROTA for both businesses. A business that needs less capital to generate a dollar of income will most likely need less dollars reinvested back into the business to maintain or increase their profits.
Capital Intensity Must Be Supported With Higher Margins
We can see that capital-intensive businesses must have higher margins to justify continuing operations. With a 5% ROTA for the asset-heavy business, it is hard to justify reinvestment in the company when market returns in a passive index fund generally averaged ~8% per year. Asset-heavy businesses need higher margins to make the ROI economics work. Moreover, the low conversion of FCF into net income makes managing an asset-heavy business difficult. Cash is not plentiful, and that counts in times of emergency. A higher margin is crucial.
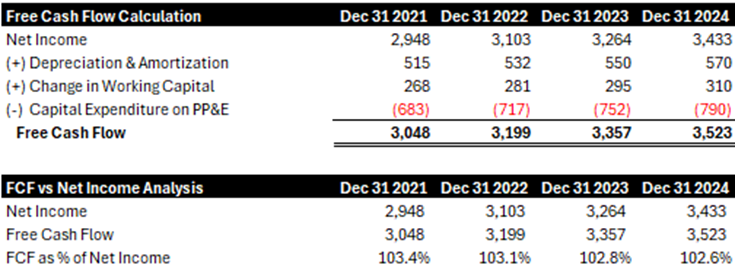
Special Point: Negative Working Capital
For most businesses, NWC is normally positive. Any increase in the NWC value requires cash to fund it – hence a subtraction from FCF. Some companies, however, will have an NWC that is normally negative (I am excluding companies that are constantly in financial trouble).
Negative NWC is common when customers pay upfront for a product or service that will be delivered at a later date. If the company is growing, so too will the negative balance – remember growth in negative NWC brings in cash! Moreover, no interest is charged on this upfront cash.
Negative working capital is common in subscription-based business models – customers pay up for recurring services or access to data or intellectual property. I work in software, where subscriptions are the normal course of business. Customers purchase access to the software upfront, annually or monthly. Therefore the company receives cash before it even does anything for the customer. If we grow the number of customers, the inflow of upfront cash grows. A negative NWC, therefore, reduces the capital intensity of a business, particularly as it grows.
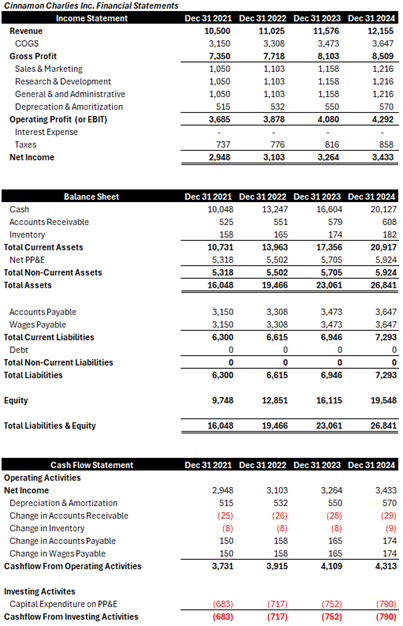
The following example of how FCF is more than Net Income due to a growing negative NWC balance. This outcome is very rare but indicates a special quality of business as customers are happy paying for a good or service before they receive it.
Real Life Examples
Look at our first species: rail shipping companies. Canadian Pacific Kansas City (“CPKC”) is a large rail shipping company controlling a network of ~20,000 miles and is the only one with a connected service across the US, Canada, and Mexico. It is a behemoth.
In 2023, the company had CAD $56B of tangible assets (divide by ~1.33 fellow Americans, or 1.6 for the Brits). Among the tangible asset base is ~ CAD $52B in PP&E broken down into tracks, carriages, and land. Despite substantial fixed assets, CPKC only generated CAD $12.6B in sales for 2023. In other words, ~$4.5 of tangible assets were needed to generate $1 of sales – not profit. CPKC is a cash guzzler and needs a large amount of assets to produce relative to its return. The company generated ~CAD $3B in Free Cash Flow (using estimates for maintenance CapEx) – a 5% FCF return on tangible assets.
In contrast, Fair Isaac Corporation is incredibly capital-light (or asset-light). The company is commonly known for providing credit scores (FICO score) but it also provides software. To provide their credit score services, all the company needs is some fancy formulas, humans and an office building while the software requires some servers, code and maybe a couple of laptops. There isn’t that much to the asset base with ~$600M in tangible assets. The company, however, produces $1.65B in sales, and ~$560M in Free Cash Flow per year. Using the same analysis above, Fair Isaac needs $0.36 of tangible assets to generate $1 of sales and has FCF return on tangible assets of >100 %. The outstanding economics from an extremely capital-light and a very strong franchise.
Conclusion
You now have the tools to assess how hungry/asset-heavy you business is. This depends on the type of business model . Being aware of this this framework is helpful when thinking about how much cash you will have at the end of the year, as well as business quality.
Quote of the Post
We prefer businesses that drown in cash. An example of a different business is construction equipment. You work hard all year and there is your profit sitting in the yard. We avoid businesses like that. We prefer those that can write us a check at the end of the year.” – Charlie Munger, 2008 Berkshire Hathaway Annual Meeting